Skip to content

Cookies 🍪

This site uses cookies that need consent.

Learn more

Zur Powderguide-Startseite Zur Powderguide-Startseite

Language selection

Search PowderGuide

WeatherBlogs

WeatherBlog 19 | Conspiracy theories and supercomputers

The wonderful world of weather and the internet

by Lea Hartl 03/08/2016
The WeatherBlog has stumbled across some strange conspiracy theories and is calling for reflection and not believing everything on the internet. It's a bit like the supposedly waist-deep snow on Instagram that only reaches as far as the second buckle on your ski boots. What's more, the ECMWF now has a powerful computer and is better at forecasting.

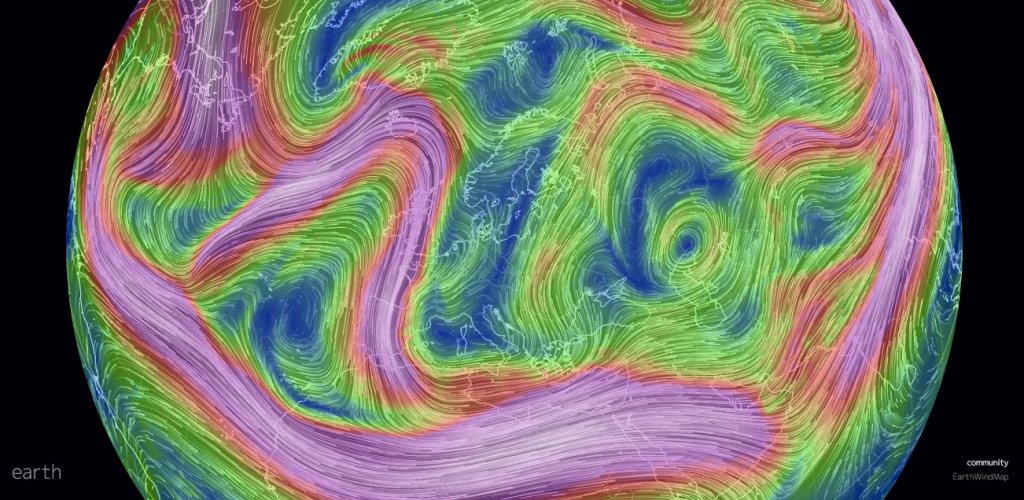
On February 25, the wonderful website earth.nullschool showed strangely high levels of carbon monoxide over California. Earth is a nice program that animates weather data (primarily GFS) and makes the result freely available. You can zoom around in it very nicely and if you don't know it, you should have a look at it and enjoy it. In any case, in addition to things like wind, pressure and temperature, Earth also shows various aerosols and other substances of interest in terms of air chemistry, including carbon monoxide (CO). This data comes from NASA's GOES-5 model. This in turn is based on satellite data measured by a MODIS instrument on the EOS-Terra satellite. If you look a little closer, you will find the following disclaimer regarding GOES-5 on Earth's About page, taken from the corresponding NASA page: Forecasts using the GEOS system are experimental and are produced for research purposes only. Use of these forecasts for purposes other than research is not recommended.

Maybe most people don't read that far, and if you were to be nasty, you'd say some people don't even want to know. In any case, the unusual surge of modeled (!) carbon monoxide over the US West Coast was noticed and a bizarre discussion took its course. On a suspicious website, which we prefer not to mention by name here, it was explained that the CO concentrations were definitely real, although no measurements from the affected area showed anything even remotely similar. Furthermore, an obscure article was unearthed that explained in vague reasoning that CO emissions at tectonic plate boundaries precede large earthquakes. The perfect basis for senseless scaremongering on the internet was born. On Earth's Facebook page, the useful advice quickly appeared: "Always be skeptical of sites that peddle fear! They feed on people's anxiety and have little incentive to report the truth.", with the addition that it was probably a model error. A little later, NASA explained in a statement that it was indeed a mistake that happened for reasons X,Y and Z and that there was no need to get worked up about it.

Animated version.

Unimpressed by all this (as well as a Snopes post and various other lengthy debunks ), the internet discussion continued apace. Because NASA wants to deceive us all for unclear reasons and the lying press and all. The WeatherBlog visits Earth's FB page from time to time and, in a fit of late-night boredom, has read some of it with fascinated horror.

Here's an urgent note: There are extensive quality controls for all measurement data used in operations for a reason. Models of all kinds also retain the status of "experimental" for a long time because they are very complex and sometimes things don't work. Blind trust in data and graphics that you don't even know where they come from just because they are somewhere on the internet is just as inadvisable as absolute, irrational distrust of institutions such as NASA, which incidentally is very intensively involved in such quality checks, even for "simple" measured variables such as temperature.

WeatherBlogs
presented by

ECMWF below 10km resolution for the first time

In other news: The European Centre for Medium-Range Weather Forecasts in Reading, England, operates one of the largest global weather models. The model data is used by many organizations worldwide, including the Austrian Meteorological Service (ZAMG) for many different applications. After several years of development work, the ECMWF now calculates forecasts for the entire planet for the first time with a resolution of 9 km, which means that the weather is calculated for over 900 million points on the earth. Previously, there were only around a third as many with a resolution of 16 km. 20 years ago, the best resolution was 100km, 10 years ago it was 25km. The ECMWF considers the improved resolution, which goes hand in hand with a massive improvement in computing efficiency, to be one of the most significant developments in its 40-year history. The forecast quality is expected to improve by 2 to 3 %, meaning that it is now possible to look reliably into the weather future for around half a day longer.

Improvements and new developments in numerical weather forecasting are closely linked to the development of increasingly powerful supercomputers. The ECMWF operates one of the most powerful computers on the continent, with a peak performance of 3593 terraflops, i.e. 3593 trillion computing operations per second. According to the ECMWF, there is room for improvement in short-term forecasting, especially for thunderstorm forecasts (associated with heavy precipitation or hail). They are working on the efficient use of the latest generation of mass parallel computers, supercomputers with several 100,000 processors.

Until then...

...we are left with the usual, dull (or good?) weather report: The Alps are in the area of influence of a high-pressure bridge that stretches from the Atlantic to Russia. A low has settled in the Mediterranean region. As a result, the Alps are in a north-easterly high-altitude current that transports dry air to us. Accordingly, the next few days look fairly sunny, with the eastern Alps becoming increasingly cloudy from Friday. In the west, it should remain friendly until after the weekend, albeit with strong winds in places.

Photo gallery

This article has been automatically translated by DeepL with subsequent editing. If you notice any spelling or grammatical errors or if the translation has lost its meaning, please write an e-mail to the editors.

Show original (German)

Related articles

Comments

WeatherBlogs
presented by