Skip to content

Cookies 🍪

This site uses cookies that need consent.

Learn more

Zur Powderguide-Startseite Zur Powderguide-Startseite

Language selection

Search PowderGuide

SnowFlurry

SnowFlurry 3 2020/21 | Snow profile review

Practice makes perfect

by Lukas Ruetz 12/05/2020
Avalanche warning services, PowderAlert and WeatherBlog have intensively discussed the current situation regarding the intensive new snowfall in the south and the build-up of old snow cover. That's why we're devoting ourselves here to an exemplary snow profile from mid-November. How do you read it and how do you interpret it?

Read profile

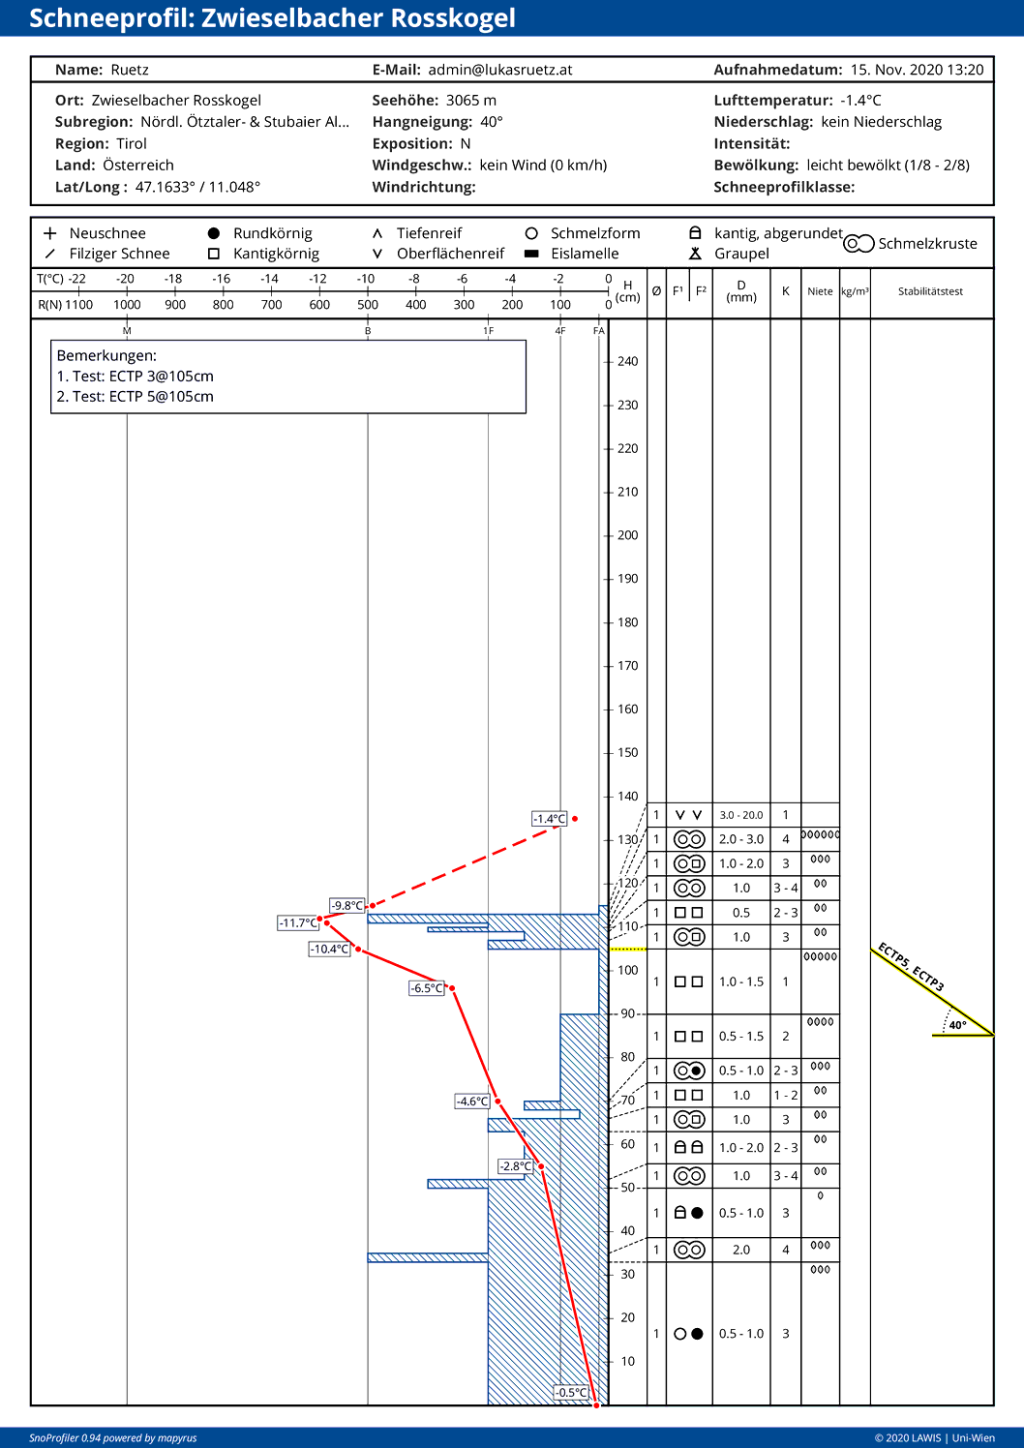
The snow profile was recorded on November 15th on the Zwieselbacher Rosskogel at 3065m in the Stubai Alps. It is a 40° steep north-facing slope. During the profile recording it is slightly cloudy, the air temperature is -1.4°C and there is no wind.

For the profile, 16 layers were carved out by hand, which are distributed over a snow depth of 115 cm. Incidentally, the snow depth is the thickness of the snow cover measured vertically. The snow thickness would be the thickness of the snowpack measured at right angles to the ground.

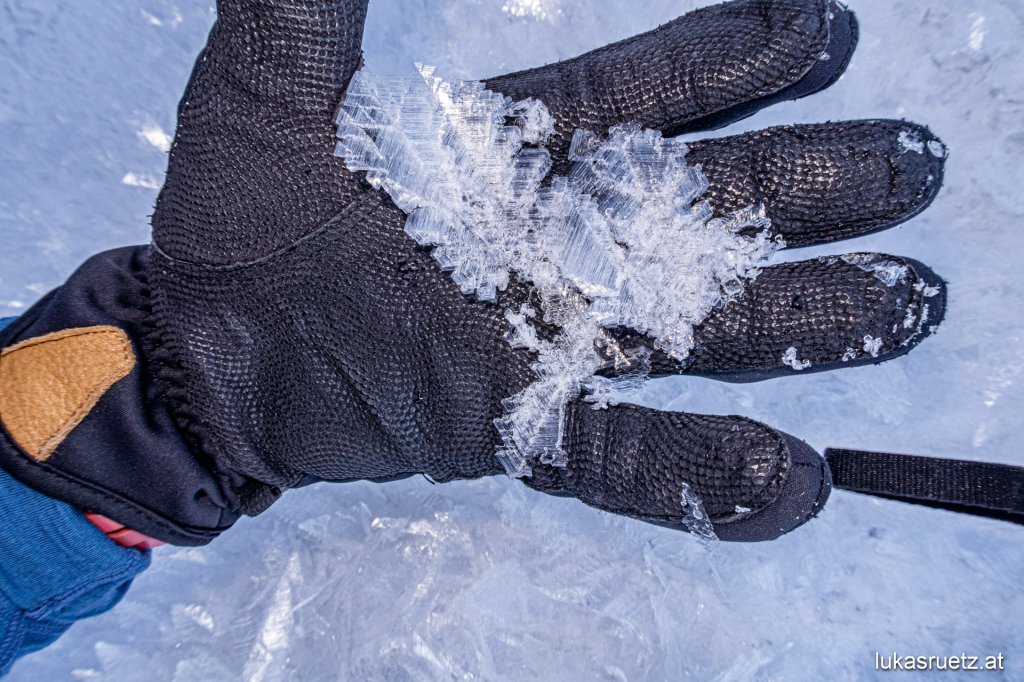
In the upper area, it is a sequence of melt crusts (spectacle symbol) and moderately built-up transformed layers in between (square symbol). Directly on the surface we find surface frost with a grain size of three to 20 millimeters, i.e. already huge, platelet-shaped crystals. This surface frost sits on a fusion crust that has already undergone some noticeable structural transformation - which is why the glasses sometimes show a square instead of a circle.

Below the five-layer structure of the clearly structurally transformed fusion crust is an extremely soft layer (hardness 1, blue bar deflects only minimally to the left), which has also been structurally transformed and which we can see from 105cm to 90cm. The angular crystals of this layer are 1 - 1.5 millimeters in size. There are five rivets at the upper layer boundary to the fusion crust. These are automatically calculated by the snow profile program and show large differences between the layers in terms of hardness, grain size and grain shape, among other things. It is easier to trigger a fracture at the layer boundaries with many rivets. An ECT - Extended Column Test - was carried out twice as a snow cover test (see comments field). In the total of 30 impacts of each ECT, only one fracture was triggered in the entire snowpack. However, the ECTP result was achieved on the third and fifth impact respectively. The P stands for propagation and indicates that the weak layer is broken over the entire width of 90 cm, not just under the blade where you hit it. This is referred to as fracture propagation.

Below this, we find another only slightly pronounced, angular layer below an even weaker crust. And below approx. 65 cm, the snowpack becomes much harder and more compact. We also only find old, built-up layers that have already been able to degrade again. These are the angular-rounded crystals between the crusts. The lowest layer consists of round-grained snow and melt forms. There is no evidence of the formation of a weak layer of old snow here.

The temperature profile in the snow cover shows a strong gradient at the top with a change from -11.7°C to -6.5°C over around 15cm. So 5.2°C difference on only 15cm. Below this, the gradient becomes steeper, i.e. less pronounced. There is almost a meter of snow between the measurement of -6.5°C and -0.5°C on the ground. The gradient is therefore only 6°C/1m.

SnowFlurry
presented by

Interpreting the profile

General information

If it is not a blown-in basin and there is a similar amount of snow all around the profile location, it makes sense to use touring skis in this area at the time of recording. The snow cover is thick enough and, above all, compact enough not to sink to the bottom in loose powder snow or in continuous, loose, recycled powder.

Temperature curve

Since the sky was only slightly cloudy at the time the photo was taken and we were on a 40° steep north-facing slope with the low position of the sun in mid-November, it was to be expected that the snow surface would be around 10°C colder than the air. Due to the previous days of fine weather without precipitation, the massive temperature gradient in the upper part of the snow cover is also no surprise. In the top 20 centimetres or so of the snow cover, the build-up transformation was taking place on a massive scale at the time the photo was taken. The melt crusts are thus visibly dissolving, becoming softer and more fragile. Their melt forms transform into angular crystals. However, the distinctive, soft weak layer underneath also undergoes a noticeable structural transformation - the crystals become larger and larger. If this continues for many more days, floating snow will form here.

In the lower area of the snow cover, the temperature gradient is too weak for the constructive transformation. The degrading transformation is currently at work here. You can already see the products of this with the round-grained and angular-rounded crystals.

Avalanche danger

At the time of the photo, there is no pronounced problem here. Although the snow cover test yields extremely poor results with the combo of low load along with fracture propagation. A hard melt crust as the only layer above the weak layer is only extremely rarely suitable for large-scale fracture propagation and thus an avalanche. The fracture propagation within a weak layer is always a product of the properties of the snowboard and the weak layer together. If the board does not fit over it or is not there in the first place, there is no problem. A slab avalanche cannot be ruled out with a hard melt crust as the only part of the overlying snowboard, but it is very unlikely. Otherwise, you wouldn't be able to venture into the terrain in spring with the load-bearing snow cover.

Outlook

However, the profile and the test do not bode well for the future. The most prominent, angular layer is extremely soft and as soon as there is a suitable board of drift or fresh snow over it, it will most likely be red hot here. The huge surface frost crystals also come into question as a toxic weak layer as soon as there is snow on top.

It is not easy to find out why the surface frost has formed without having dug the profile yourself. But with the coordinates in the info box above or in the profile database on lawis.at, where each profile location has been marked on a map, you can at least assume that the surface rime was caused by the nigg effect.

In this case, the nigg effect was indeed responsible. The profile is located directly under a ridge on the shaded side. In the Nigg effect, warm air rises thermally on the sunny side and then sinks down again behind the ridge on the shaded side, releasing the moisture to the relatively colder snow surface. As a result, the moisture in the air freezes onto the snow surface and the surface frost grows.

In the lower part of the snow cover, by the way, there are no major problem children. No problems should arise there even with intensive new snowfall and heavy accumulation.

For the fanatics: Allocation according to snowfall and weather phases

It is often possible to allocate the weak layers and crusts - if you know the exact weather pattern, the possible rain line and cloud cover conditions for a region. In our case, the crust near the surface comes from the rain and the warm, humid air from November 3 and 4.

The two loose, angular layers underneath were the intensive new snowfall from the end of October with over 50 cm at this location.

Conclusion

An exemplary profile that shows the limitations of snow cover test results very well! One or more poor to appalling test results or a few good test results say nothing about the overall situation and do not allow any conclusions to be drawn about snowpack stability on their own. Nor can they be used to assess individual slopes. Even if, unfortunately, this is still what you learn in many training courses. A snow profile and a snowpack test only ever represent one piece of the mosaic in the overall situation. They can be representative - but they don't have to be! It is important to place the piece in the overall picture and to continue working with it, not to base your decisions on it alone. This requires far more knowledge and experience than interpreting a test result alone and is unfortunately only possible for a few professionals.

Note: Many current snow profiles from the Eastern Alps can be found at lawis.at/profile and mainly from America and New Zealand at snowpilot.org

This article has been automatically translated by DeepL with subsequent editing. If you notice any spelling or grammatical errors or if the translation has lost its meaning, please write an e-mail to the editors.

Show original (German)

Related articles

Comments

SnowFlurry
presented by