Skip to content

Cookies 🍪

This site uses cookies that need consent.

Learn more

Zur Powderguide-Startseite Zur Powderguide-Startseite

Language selection

Search PowderGuide

SnowFlurry

SnowFlurry 8 2016/17 | Measuring stations and other tools for tour planning

There is a lot more than just the avalanche report

by Lukas Ruetz 12/23/2016
There are many online aids for tour planning and risk assessment that go beyond the classic tools such as maps, guides, avalanche bulletins and conditions reports. They are particularly relevant at the start of the season or when half of your friends are already spending their free time at the outdoor pool and there is hardly any information available from the warning services.

Measuring stations - basics

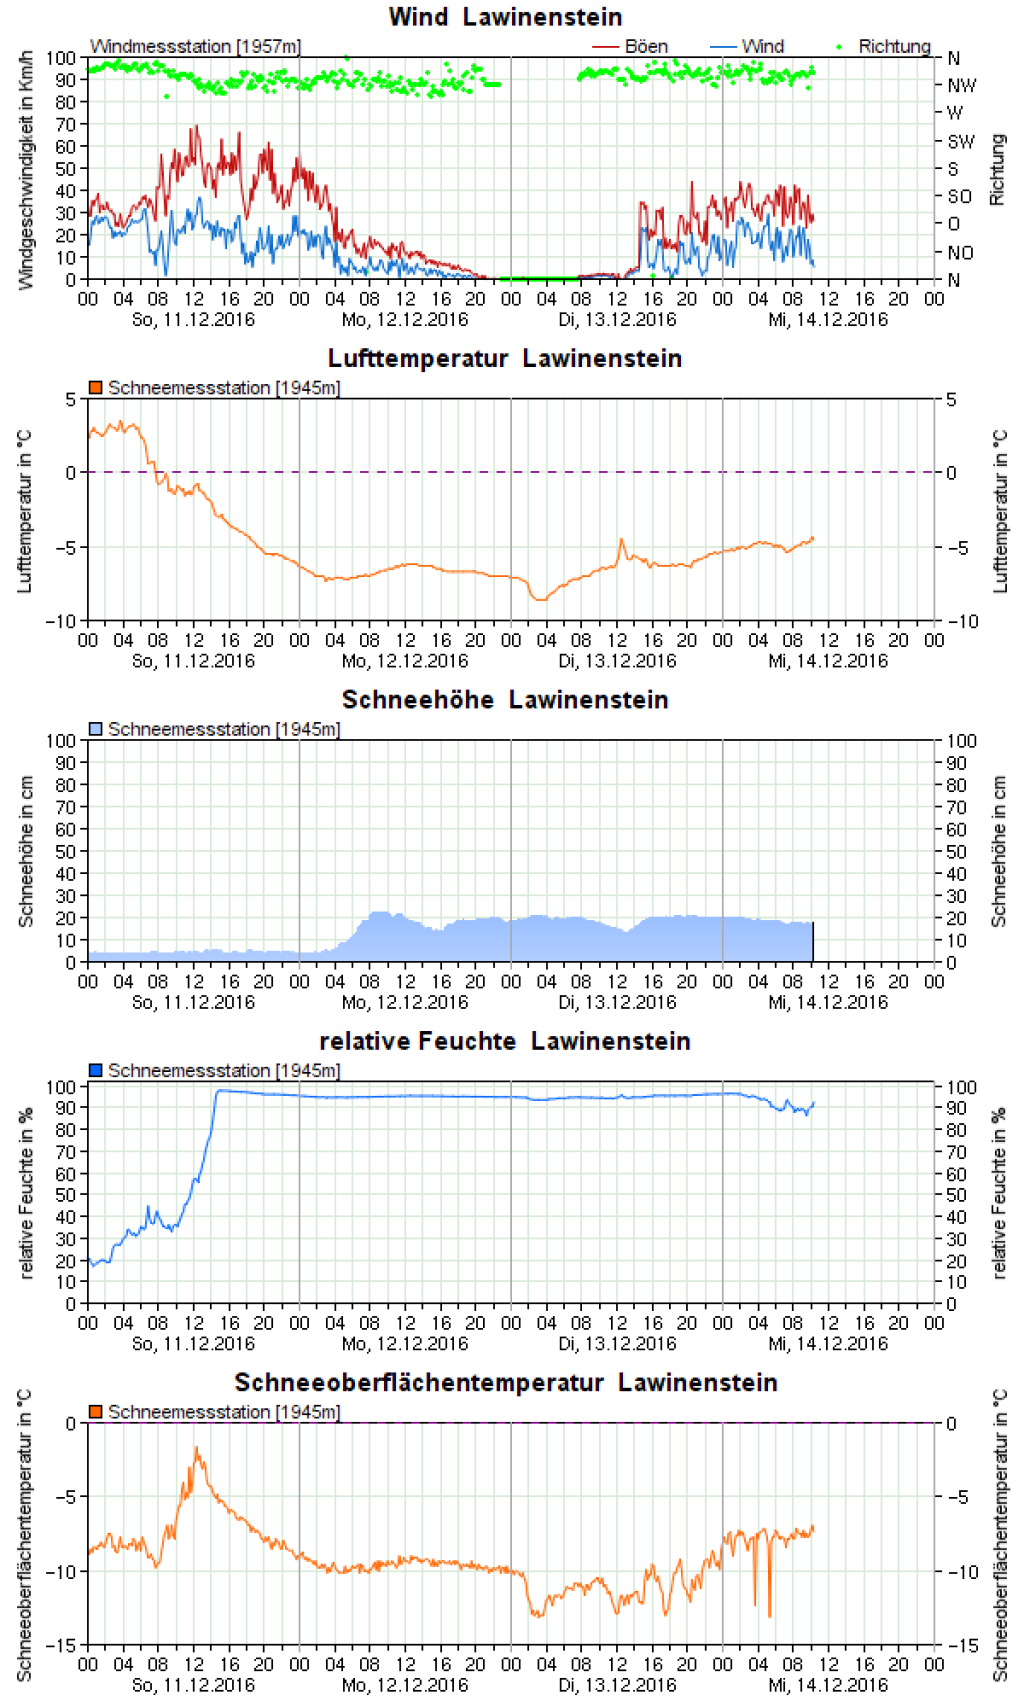
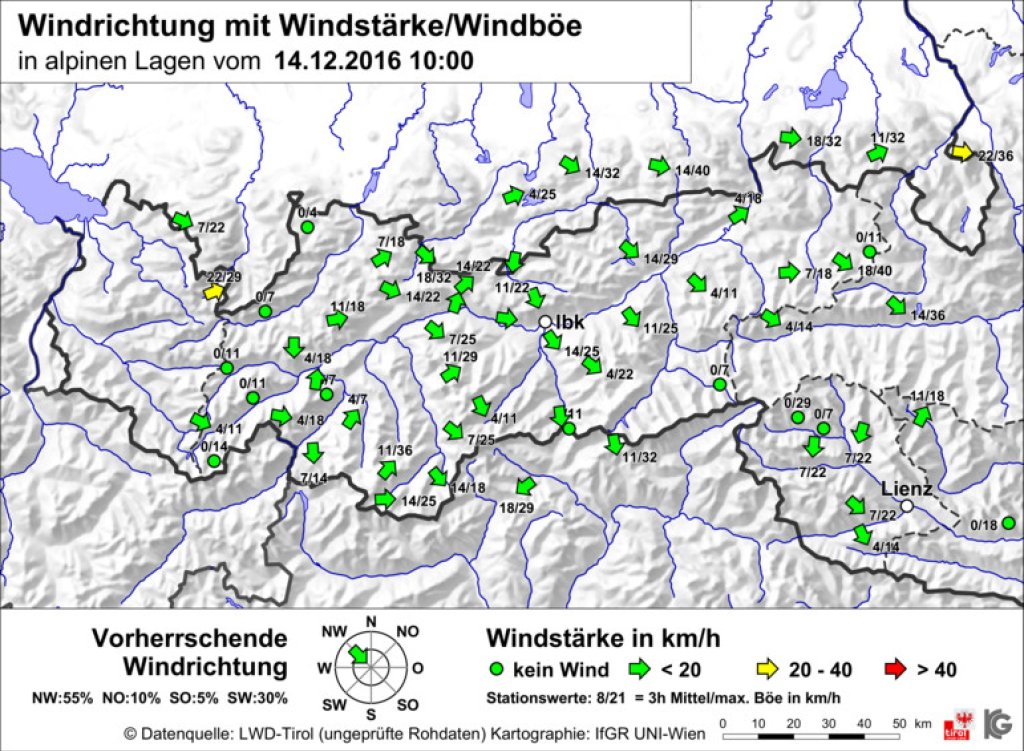
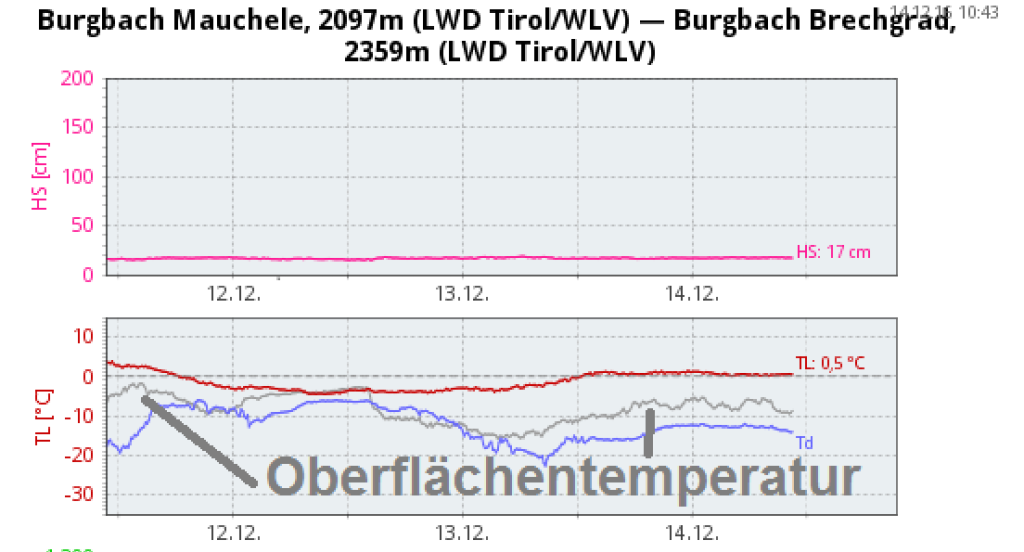
There are many different types of measuring stations and techniques in the mountains. The avalanche warning services in the Alpine region make most of the station data available online. The most important parameters here are air temperature, dew point or relative humidity, wind strength and direction, snow depth and the amount of fresh snow. In addition, the surface temperature, global radiation, albedo, air pressure and snow temperature are sometimes measured at different heights within the snow cover. There is often a snow station below ridge and summit level and a wind station higher up at a station location. In most cases, all other parameters are also measured by both stations. The cost of setting up a new station for a site is always in the five-figure euro range. In addition, maintenance and servicing can be quite costly. It is relatively common for instruments to be damaged by external influences and have to be repaired or replaced. In the vast majority of cases, data is transmitted via the GSM network, i.e. via the infrastructure of a mobile phone company, and this adds further costs. Stations that are located outside the cell phone network cannot transmit their data to the servers on a regular basis and are therefore generally not visible online. A healthy degree of skepticism is extremely important when personally analyzing station data and graphs. This is so-called unchecked raw data that has not been checked or corrected. This means that if a measuring instrument provides incorrect data - which is not that rare - it will be passed on in the same way.

SnowFlurry
presented by

Snow depth

The most common misinformation is provided by snow depth measurement: Firstly, the snow depth from one location - no matter how sheltered from the wind - is not very meaningful for larger scales. Secondly, it happens again and again that the surface conditions (especially due to plants) and thus the height of the ground changes and the snow depth can therefore not be determined correctly. This means that the snow depth of a station is only of very limited use for tour planning. In early winter, you need to know the terrain and surface conditions of the location very precisely in order to determine the feasibility of a tour using the snow depth. Even more important: the snow quality and density. The current snow situation in the Eastern Alps is a good example of this: Even 70cm of snow cover is of little use if it is almost completely built up and you sink through it. On grassy surfaces, 20cm of slightly consolidated snow can be enough to allow you to ski without contact with the ground. No station can help here, only process thinking, if no other processed information is available from specialist channels.

Global radiation

Global radiation is the sum of the solar radiation that hits the ground - i.e. the radiant energy of the sun. Visible light is only part of the radiation emitted by the sun. In the Alpine region, global radiation reaches a maximum of around 400 watts per square meter at midday at the end of December. At the end of June, the value rises to over 1,200 watts. The curve of global radiation over the last few days may be interesting for tour planning: If the curve is frayed, clouds have passed through during the "fringes", which have dampened the radiation intensity - if the curve is completely flattened, you can assume a completely cloudy day. Particularly interesting from February onwards with regard to the spread of broken snow.

Wind strength and direction

As the supra-regional wind direction cannot be determined from one station due to local deflection effects that are almost always present, the overall situation should be assessed using several stations or a collective visualization such as that from LWD Tirol should be used, see here. The wind is of course quite easy to use for planning purposes: The stronger it blows, the more frequently drift snow packs are present and the more powerful they are. They are mainly found in exposures that are aligned in the direction of the wind. The estimate is made in combination with the air temperature: the colder it is, the more susceptible they are to disruption. You can also see when the wind has died down to a speed of approx. 20 km/h (depending on the snow conditions, of course) and thus estimate the age of potential drift snow packs. In addition, sudden changes in wind direction indicate whether the location is already under the influence of a front or not - as with south föhn: if the direction changes abruptly and the wind strength drops briefly north of the main ridge, the precipitation of the forecast front is about to begin. If the anemometer shows an exactly constant wind direction at zero wind force, the anemometer is frozen - usually only temporarily. In a spring avalanche situation (soaked or soaked snow cover, avalanche danger for the skier depends primarily on the nightly formation of snow cover), strong wind is an advantage: there is hardly any snow to be transported or the brittleness of drift snow packs is very low, but the wind cools the surface massively through evaporative cooling as fresh, water vapor-absorbing air is constantly being supplied - more on this below.

Temperature

On the one hand, the temperature helps with the question of what clothing to pack. On the other hand, it also helps with the brittleness of snow packs: If temperatures of around 0°C or warmer prevail, drift snow packs of fresh snow are less brittle (fragile) and drift snow packs that are formed from an existing snowpack also lose their brittleness more quickly. Nevertheless, fresh drift snow is always a danger and should be consistently avoided! However, the warmer it is (or has been in the last few days), the faster the brittleness of formed drift snow decreases.

Dew point & relative humidity

An air parcel can absorb more water vapor as the temperature rises. The absorption capacity increases exponentially, just like the avalanche risk with increasing danger level. If the amount of water in the air parcel rises above the maximum amount, the excess water vapor condenses and forms water droplets, i.e. fog or clouds. This means that the colder the air parcel is, the less water it can hold and, conversely, the warmer the air becomes, the more water vapor it can "carry". As soon as the air packet has cooled down to such an extent that the water vapor reaches the limit value, the moisture condenses - and the dew point is reached. The dew point is therefore the temperature to which the air must be cooled before the water vapor begins to condense. If the dew point is very low, the relative humidity is also low. If the dew point approaches the air temperature, the relative humidity increases. If the dew point is equal to the air temperature, the relative humidity is 100%. The air is saturated with water vapor. There may be little or no condensation or fog and clouds may already be present.

SnowFlurry
presented by

The dew point alone says nothing about cloud cover. For planning purposes, the dew point is very interesting in spring: the more humid the air is, the less it can absorb moisture from the snow surface and thus cool the snow surface. If the snow sublimates or the moisture on the surface evaporates and turns into water vapor, energy is extracted from the snow cover, which means that it soaks through more slowly or forms a thicker layer of snow at night. The combination of dew point, air temperature and.....

...surface temperature

can provide an extremely good basis for estimating the avalanche risk in a classic spring situation. When the snow surface reaches zero degrees Celsius, soaking begins. The longer the surface temperature does not reach freezing point, the longer the snow cover can last. If the surface temperature curve delivers values above the freezing point, it is icy at the measuring station. However, if the snow depth determines a positive value in this case, there is a measurement error. Incidentally, the snow surface of a soaked snow cover remains stable on a cloudless night up to an air temperature of roughly +5°C - however, this depends very much on the air humidity and can only be used as a really rough guide! Because as mentioned: the drier the air, the more snow can sublimate on the surface or moisture can turn into water vapor and thus the surface is better cooled.

Webcams

If you combine the last three parameters with the webcams at www.foto-webcam.eu, which you can use to perfectly estimate the degree of cloud cover at night, you have a really good basis for planning in spring situations. The webcams in this portal work with SLR cameras that expose their images at night for up to 30 seconds. This means that the photos at night are so bright that you can estimate the degree of cloud cover and thus draw conclusions about the ability of the snow cover to radiate heat - however, if the clouds pass relatively quickly during the exposure time of the individual photos, you will see a "blurred" cloud screen. The times when the snow flurries in April and May were taken in changeable weather conditions and you got up in the night to look out of the window (although the alarm clock was set early enough for the upcoming tour anyway) are now a thing of the past.

Satellite film and precipitation radar

The current satellite film and a precipitation radar are particularly helpful for the very short-term assessment of the time of the incoming fronts, which a daily weather report - whether prepared by meteorologists or purely on the basis of computers with the models - cannot estimate exactly, in order to get an idea of how far the front and its cloud or precipitation band has already progressed. For example, the satellite film from ZAMG and the Valluga precipitation radar.

Note: Tour planning with station data requires a lot of experience, but you can acquire this yourself. One value alone is of little to no use - the combination of several is very meaningful.

The Snow Stroller wishes you a Merry Christmas! The Christ Child probably won't bring us the white stuff that everyone probably had on their wish list...

Photo gallery

This article has been automatically translated by DeepL with subsequent editing. If you notice any spelling or grammatical errors or if the translation has lost its meaning, please write an e-mail to the editors.

Show original (German)

Related articles

Comments

SnowFlurry
presented by